Interpolated Waveforms
[1]:
import numpy as np
import matplotlib.pyplot as plt

import pulser
from pulser import Pulse, Sequence, Register
from pulser.devices import AnalogDevice
from pulser.waveforms import InterpolatedWaveform
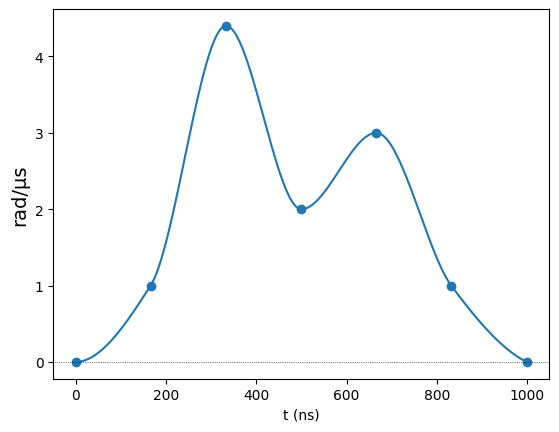
In some particular applications (the most notorious being its use in optimal control at the pulse level) it is useful to define a waveform through the interpolation of a set of data points. For these cases, Pulser provides the InterpolatedWaveform class.
In its most stripped back form, the InterpolatedWavefrom requires two things: a duration and a list of values. The placement of these values along the times axis defaults to spacing the values evenly along the whole duration of the waveform.
[2]:
# A standard interpolation (using PchipInterpolator)
duration = 1000
values = [0, 1, 4.4, 2, 3, 1, 0]
int_wf = InterpolatedWaveform(duration, values)
int_wf.draw()
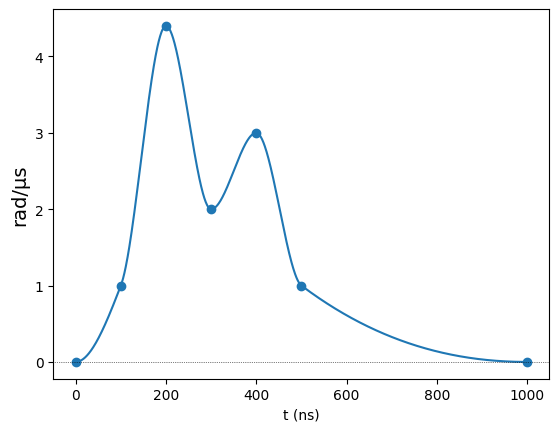
If we want to specify the time coordinate of each data point, we can do so through the times option. These should come in a list of values betwen 0 and 1, which are interperted as fractions of the total duration. As an example, below we specify that the values are all bunched in the first half of the waveform, except for the last one, which is left at the end.
[3]:
ts = np.r_[np.linspace(0.0, 0.5, num=len(values) - 1), 1]
int_wf_t = InterpolatedWaveform(duration, values, times=ts)
int_wf_t.draw()
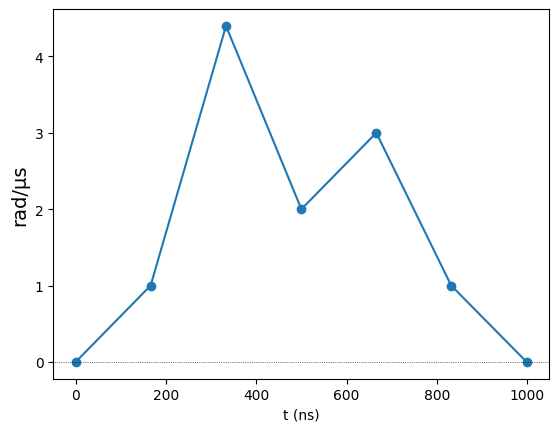
The other crucial component is the interpolator. Currently, the class supports two interpolator classes from the scipy.interpolate module: PchipInterpolator (chosen by default) and interp1d. Below, we change the interpolator to interp1d, which does a linear interpolation by default:
[4]:
int_wf2 = InterpolatedWaveform(duration, values, interpolator="interp1d")
int_wf2.draw()
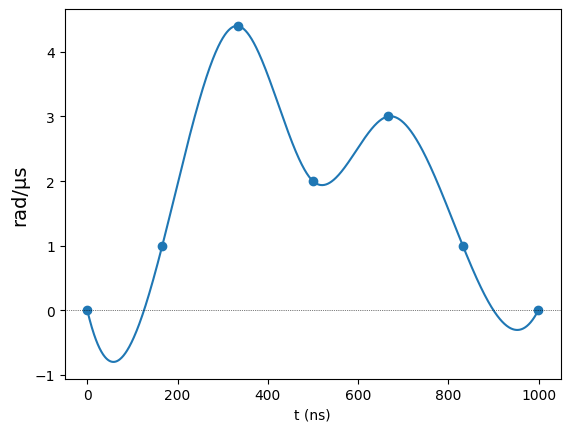
One can also change the optional parameters of the chosen interpolator by giving them to InterpolatedWaveform. For example, the interpolation with interp1d can be cubic instead of linear by changing the kind parameter.
Naturally, the choice of interpolator will dictate which extra parameters can be optionally provided. As such, one must refer to the chosen interpolator’s documentation for the specific details.
[5]:
int_wf3 = InterpolatedWaveform(
    duration, values, interpolator="interp1d", kind="cubic"
)
int_wf3.draw()
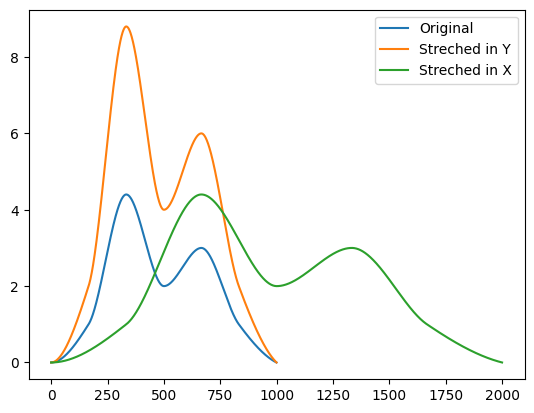
Finally, an InterpolatedWaveform can be streched or contracted in both magnitude and duration:
[6]:
# Streching an interpolated waveform
int_wf_stretch_y = int_wf * 2
int_wf_stretch_x = int_wf.with_new_duration(duration * 2)

fig, ax = plt.subplots()
ax.plot(int_wf.samples, label="Original")
ax.plot(int_wf_stretch_y.samples, label="Streched in Y")
ax.plot(int_wf_stretch_x.samples, label="Streched in X")
ax.legend()
plt.show()
Use in a parameterized sequence
The InterpolatedWaveform is used like any other waveform. In the contexts where it usually comes up, it might be helpful to incorporate it in a parametrized sequence. Below, we’ll show how to make a parametrized sequence where the data points for the amplitude and detuning waveforms are variables.
[7]:
reg = Register.square(1, prefix="q")
param_seq = Sequence(reg, AnalogDevice)
param_seq.declare_channel("rydberg_global", "rydberg_global", initial_target=0)
amp_vals = param_seq.declare_variable("amp_vals", size=5, dtype=float)
det_vals = param_seq.declare_variable("det_vals", size=4, dtype=float)

amp_wf = InterpolatedWaveform(1000, amp_vals)
det_wf = InterpolatedWaveform(
    1000, det_vals, interpolator="interp1d", kind="cubic"
)
pls = Pulse(amp_wf, det_wf, 0)

param_seq.add(pls, "rydberg_global")
From here, we can build some random sequence by specifying the values of amp_vals and det_vals. For example:
[8]:
seq1 = param_seq.build(amp_vals=[0, 2, 1, 2, 0], det_vals=[0, -5, 5, -5])
seq1.draw()
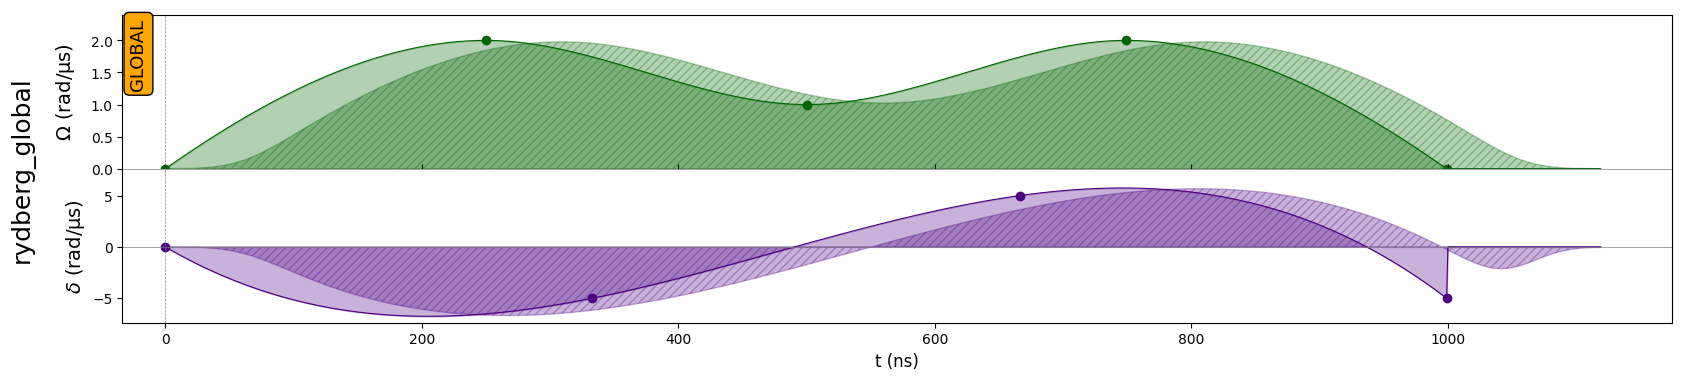
Notice how the interpolation points are automatically drawn on top of the waveforms. You can disable this option through the draw_interp_pts parameter:
[9]:
seq1.draw(draw_interp_pts=False)

In action:
InterpolatedWaveforms are useful in Quantum Adiabatic Algorithms, to design smooth waveforms in amplitude and detuning. Here are two examples of Sequences using them:
To find an Antiferromagnetic state. This tutorial goes further and shows an optimization strategy based on interpolated points of the waveform.
To solve a QUBO.