XY Hamiltonian
The XY Hamiltonian arises when the basis states are the \(|0\rangle\) and \(|1\rangle\) state of the XY basis, which is addressed by the Microwave channel. When a Microwave channel is declared, the Sequence is immediately assumed to be in the so-called XY mode.
Under these conditions, the interaction hamiltonian between two atoms \(i\) and \(j\) is given by
where \(R_{ij}\) is the distance between atom \(i\) and atom \(j\), \(C_3\) and \(C_6\) are coefficients dependent on the device and taken as \(\frac{C_3}{\hbar} = 3700 \mu m^3/\mu s\) and \(\frac{C_6}{\hbar} = 5420158.53 \mu m^6/\mu s\) for the MockDevice.
More details on the XY mode can be found in the following reference: Barredo et al. 2014. In this page, we replicate these results to show how to use this alternative mode of operation.
[1]:
import numpy as np
import matplotlib.pyplot as plt
import qutip

import pulser
from pulser import Pulse, Sequence, Register
from pulser.backend import Occupation
from pulser_simulation import QutipBackendV2, QutipConfig
from pulser.devices import MockDevice
from pulser.waveforms import BlackmanWaveform
Rabi oscillations of 1 atom
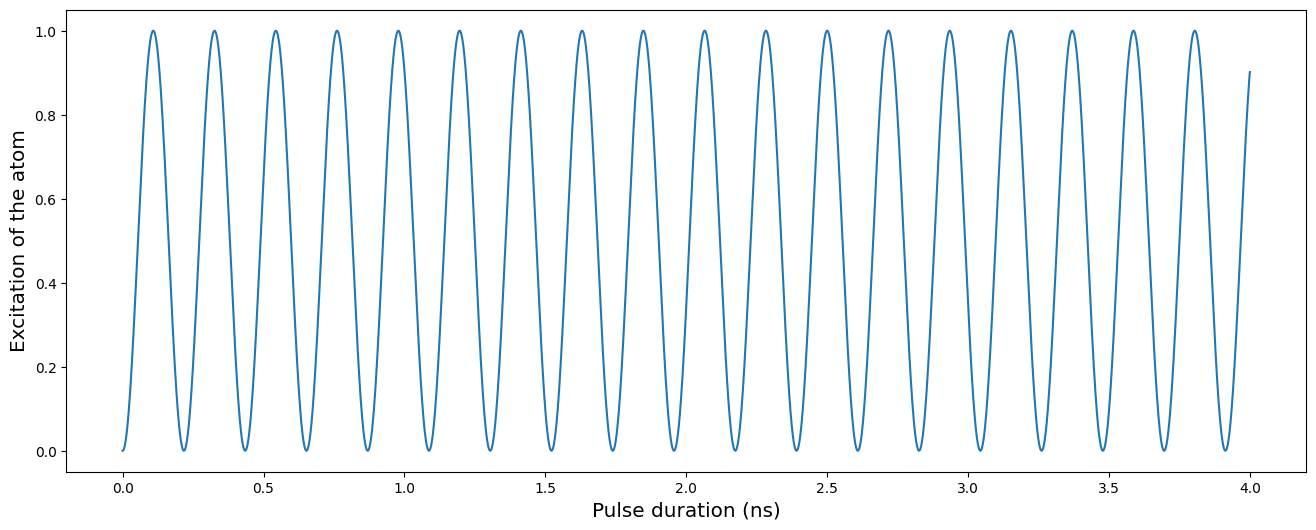
We start by showing Rabi oscillation in the XY mode in the case of a unique atom as shown in the figure 1 (c) of the reference. In a similar way as the Ising mode, the atom will oscillate between the two energy levels. The XY mode is only available in the mw_global channel. We initialize the register and instantiate the channel.
[2]:
coords = np.array([[0, 0]])
qubits = {f"q{i}": coord for (i, coord) in enumerate(coords)}

reg = Register(qubits)
seq = Sequence(reg, MockDevice)
seq.declare_channel("MW", "mw_global")
We then add a simple constant rabi pulse of amplitude \(2\pi \times 4.6\) MHz and run the simulation. The measurement is necessarily done in the XY basis.
[3]:
simple_pulse = Pulse.ConstantPulse(4000, 2 * np.pi * 4.6, 0, 0)
seq.add(simple_pulse, "MW")
seq.measure(basis="XY")

config = QutipConfig(
    observables=[Occupation()], default_evaluation_times="Full"
)
sim = QutipBackendV2(seq, config=config)

results = sim.run()
We plot the expectation of the excitation of the atom over the time.
[4]:
plt.figure(figsize=[16, 6])
plt.plot(
    [
        results.total_duration * x
        for x in results.get_result_times("occupation")
    ],
    results.occupation,
)
plt.xlabel("Pulse duration (ns)", fontsize="x-large")
plt.ylabel("Excitation of the atom", fontsize="x-large")
plt.show()
Spin chain of 3 atoms
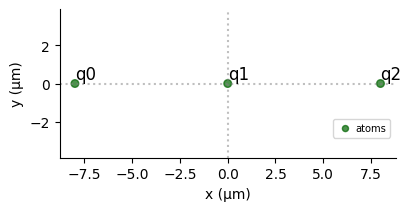
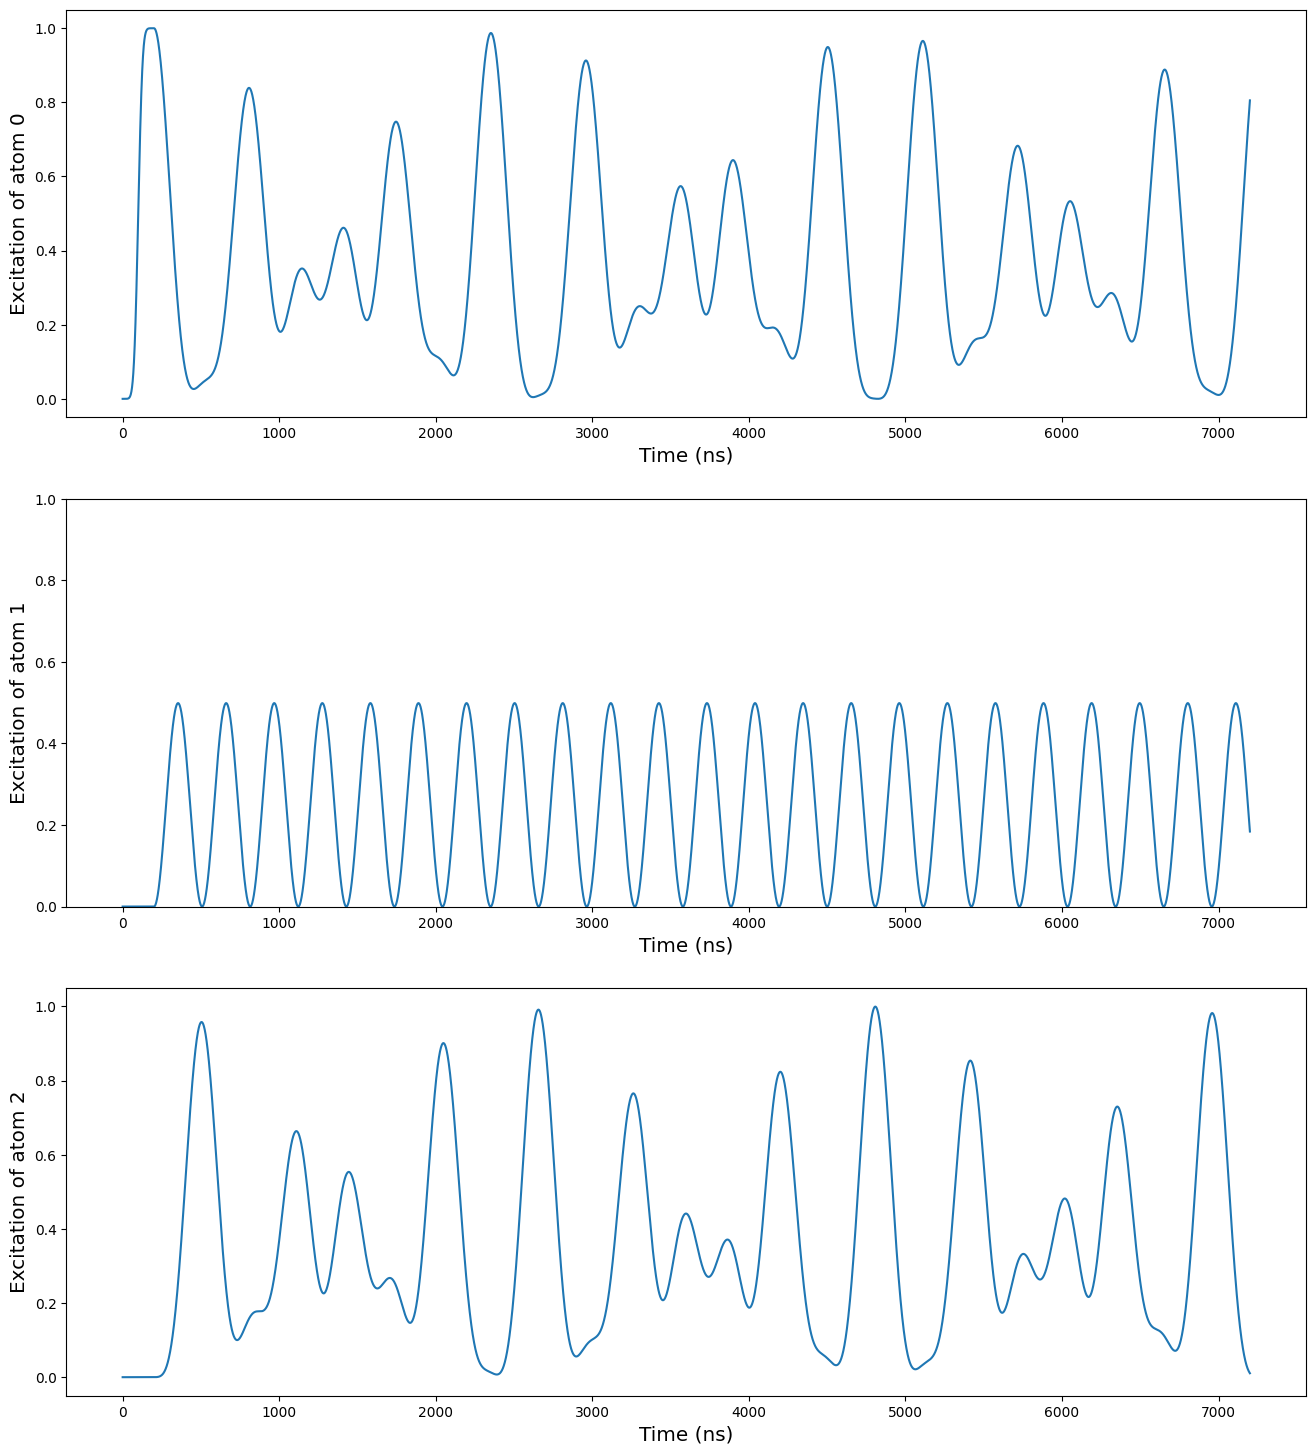
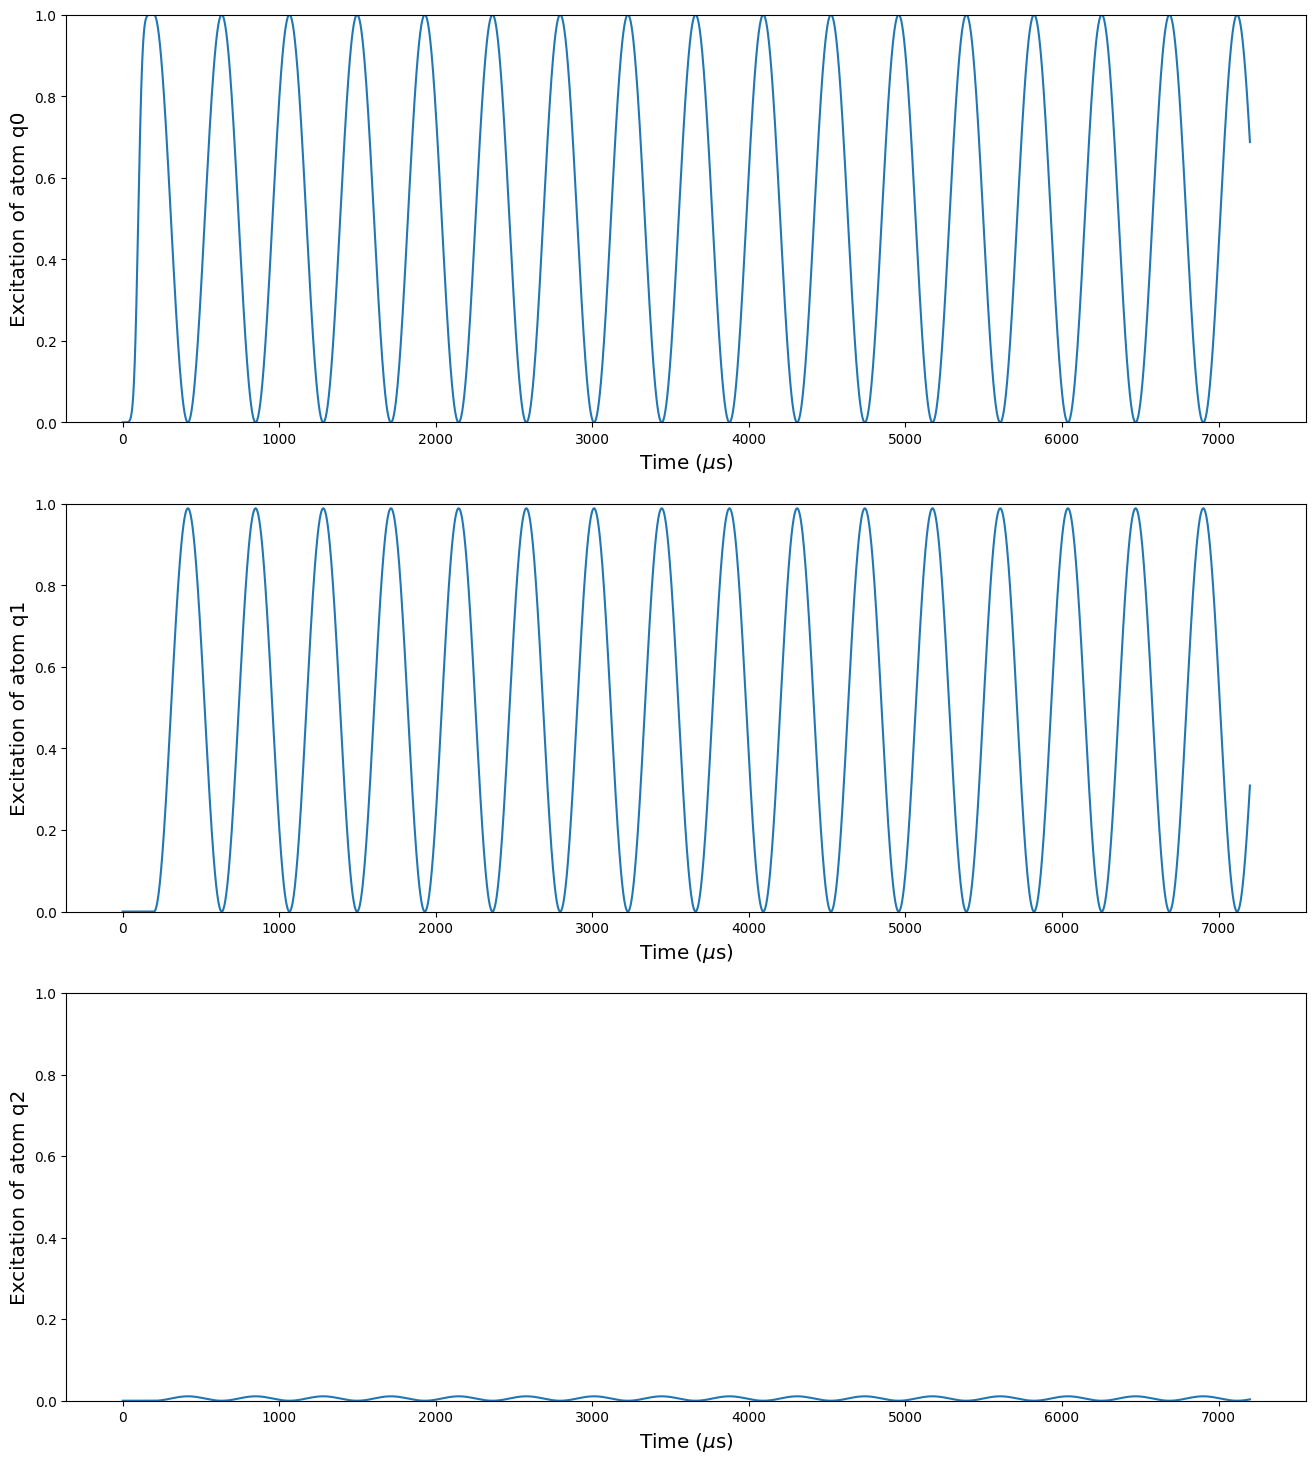
We now simulate the free evolution of a spin chain of 3 atoms, starting with 1 excitation in the initial state \(|100\rangle\) as shown in the figure 3 (c) of the reference.
[5]:
coords = np.array([[-8.0, 0], [0, 0], [8.0, 0]])
qubits = {f"q{i}": coord for (i, coord) in enumerate(coords)}

reg = Register(qubits)
seq = Sequence(reg, MockDevice)
seq.declare_channel("ch0", "mw_global")
reg.draw()

# State preparation using SLM mask
masked_qubits = ["q1", "q2"]
seq.config_slm_mask(masked_qubits)
masked_pulse = Pulse.ConstantDetuning(BlackmanWaveform(200, np.pi), 0, 0)
seq.add(masked_pulse, "ch0")

# Simulation pulse
simple_pulse = Pulse.ConstantPulse(7000, 0, 0, 0)
seq.add(simple_pulse, "ch0")
seq.measure(basis="XY")

sim = QutipBackendV2(seq, config=config)
results = sim.run()
[6]:
expectations = [
    [x[0] for x in results.occupation],
    [x[1] for x in results.occupation],
    [x[2] for x in results.occupation],
]

plt.figure(figsize=[16, 18])
plt.subplot(311)
plt.plot(expectations[0])
plt.ylabel("Excitation of atom 0", fontsize="x-large")
plt.xlabel("Time (ns)", fontsize="x-large")
plt.subplot(312)
plt.plot(expectations[1])
plt.ylabel("Excitation of atom 1", fontsize="x-large")
plt.xlabel("Time (ns)", fontsize="x-large")
plt.ylim([0, 1])
plt.subplot(313)
plt.plot(expectations[2])
plt.ylabel("Excitation of atom 2", fontsize="x-large")
plt.xlabel("Time (ns)", fontsize="x-large")
plt.show()
External field and angular dependency
An external magnetic field can be added to the experiment, and will modify the hamiltonian. The XY interaction part of the Hamiltonian is then
where \(\theta_{ij}\) is the angle between the vector of the two atoms and the external field as shown on the figure below.

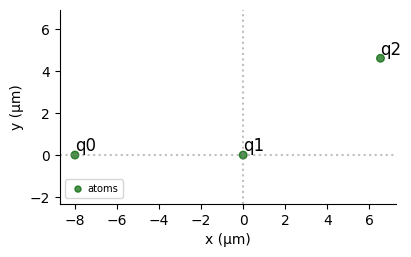
We add an external field along the Y axis, and we put the qubit 2 at the angle such that \(\text{cos}^2(\theta_{12}) = 1/3\), and the interaction between the qubits 1 and 2 cancels out. This is done by the method set_magnetic_fieldfrom the Sequence.
This is the principle that enables to create topological phases on long chain of atoms.
[7]:
coords = np.array([[-1.0, 0], [0, 0], [np.sqrt(2 / 3), np.sqrt(1 / 3)]]) * 8.0
qubits = {f"q{i}": coord for (i, coord) in enumerate(coords)}

reg = Register(qubits)
seq = Sequence(reg, MockDevice)
seq.declare_channel("ch0", "mw_global")
seq.set_magnetic_field(0.0, 1.0, 0)
reg.draw()
We then simulate again the free evolution from the initial state \(|100\rangle\).
[8]:
# State preparation using SLM mask
masked_qubits = ["q1", "q2"]
seq.config_slm_mask(masked_qubits)
masked_pulse = Pulse.ConstantDetuning(BlackmanWaveform(200, np.pi), 0, 0)
seq.add(masked_pulse, "ch0")

# Simulation pulse
simple_pulse = Pulse.ConstantPulse(7000, 0, 0, 0)
seq.add(simple_pulse, "ch0")
seq.measure(basis="XY")

sim = QutipBackendV2(seq, config=config)
results = sim.run()
[9]:
expectations = [
    [x[0] for x in results.occupation],
    [x[1] for x in results.occupation],
    [x[2] for x in results.occupation],
]

plt.figure(figsize=[16, 18])
plt.subplot(311)
plt.plot(expectations[0])
plt.ylabel("Excitation of atom q0", fontsize="x-large")
plt.xlabel(r"Time ($\mu$s)", fontsize="x-large")
plt.ylim([0, 1])
plt.subplot(312)
plt.plot(expectations[1])
plt.ylabel("Excitation of atom q1", fontsize="x-large")
plt.xlabel(r"Time ($\mu$s)", fontsize="x-large")
plt.ylim([0, 1])
plt.subplot(313)
plt.plot(expectations[2])
plt.ylabel("Excitation of atom q2", fontsize="x-large")
plt.xlabel(r"Time ($\mu$s)", fontsize="x-large")
plt.ylim([0, 1])
plt.show()
We can see there that there is almost no excitation in the qubit 2. It still remains some because the interaction between the qubits 0 and 2 is not completely negligible.